Condition Details
Review the full evaluation result set as a searchable table and document individual conditions.
Overview
The Details tab shows the full evaluation result set as a data table.
In the product, Overview and Details live on the same analytics screen as two tabs. In the documentation, they are split into separate pages so the chart-based view and the table-based view are easier to explain.
Use Condition Details when you want to review every condition in a structured list instead of reading the results through charts and graphs.
The Results Table
The table is populated from the selected evaluation and shows each guideline condition individually.
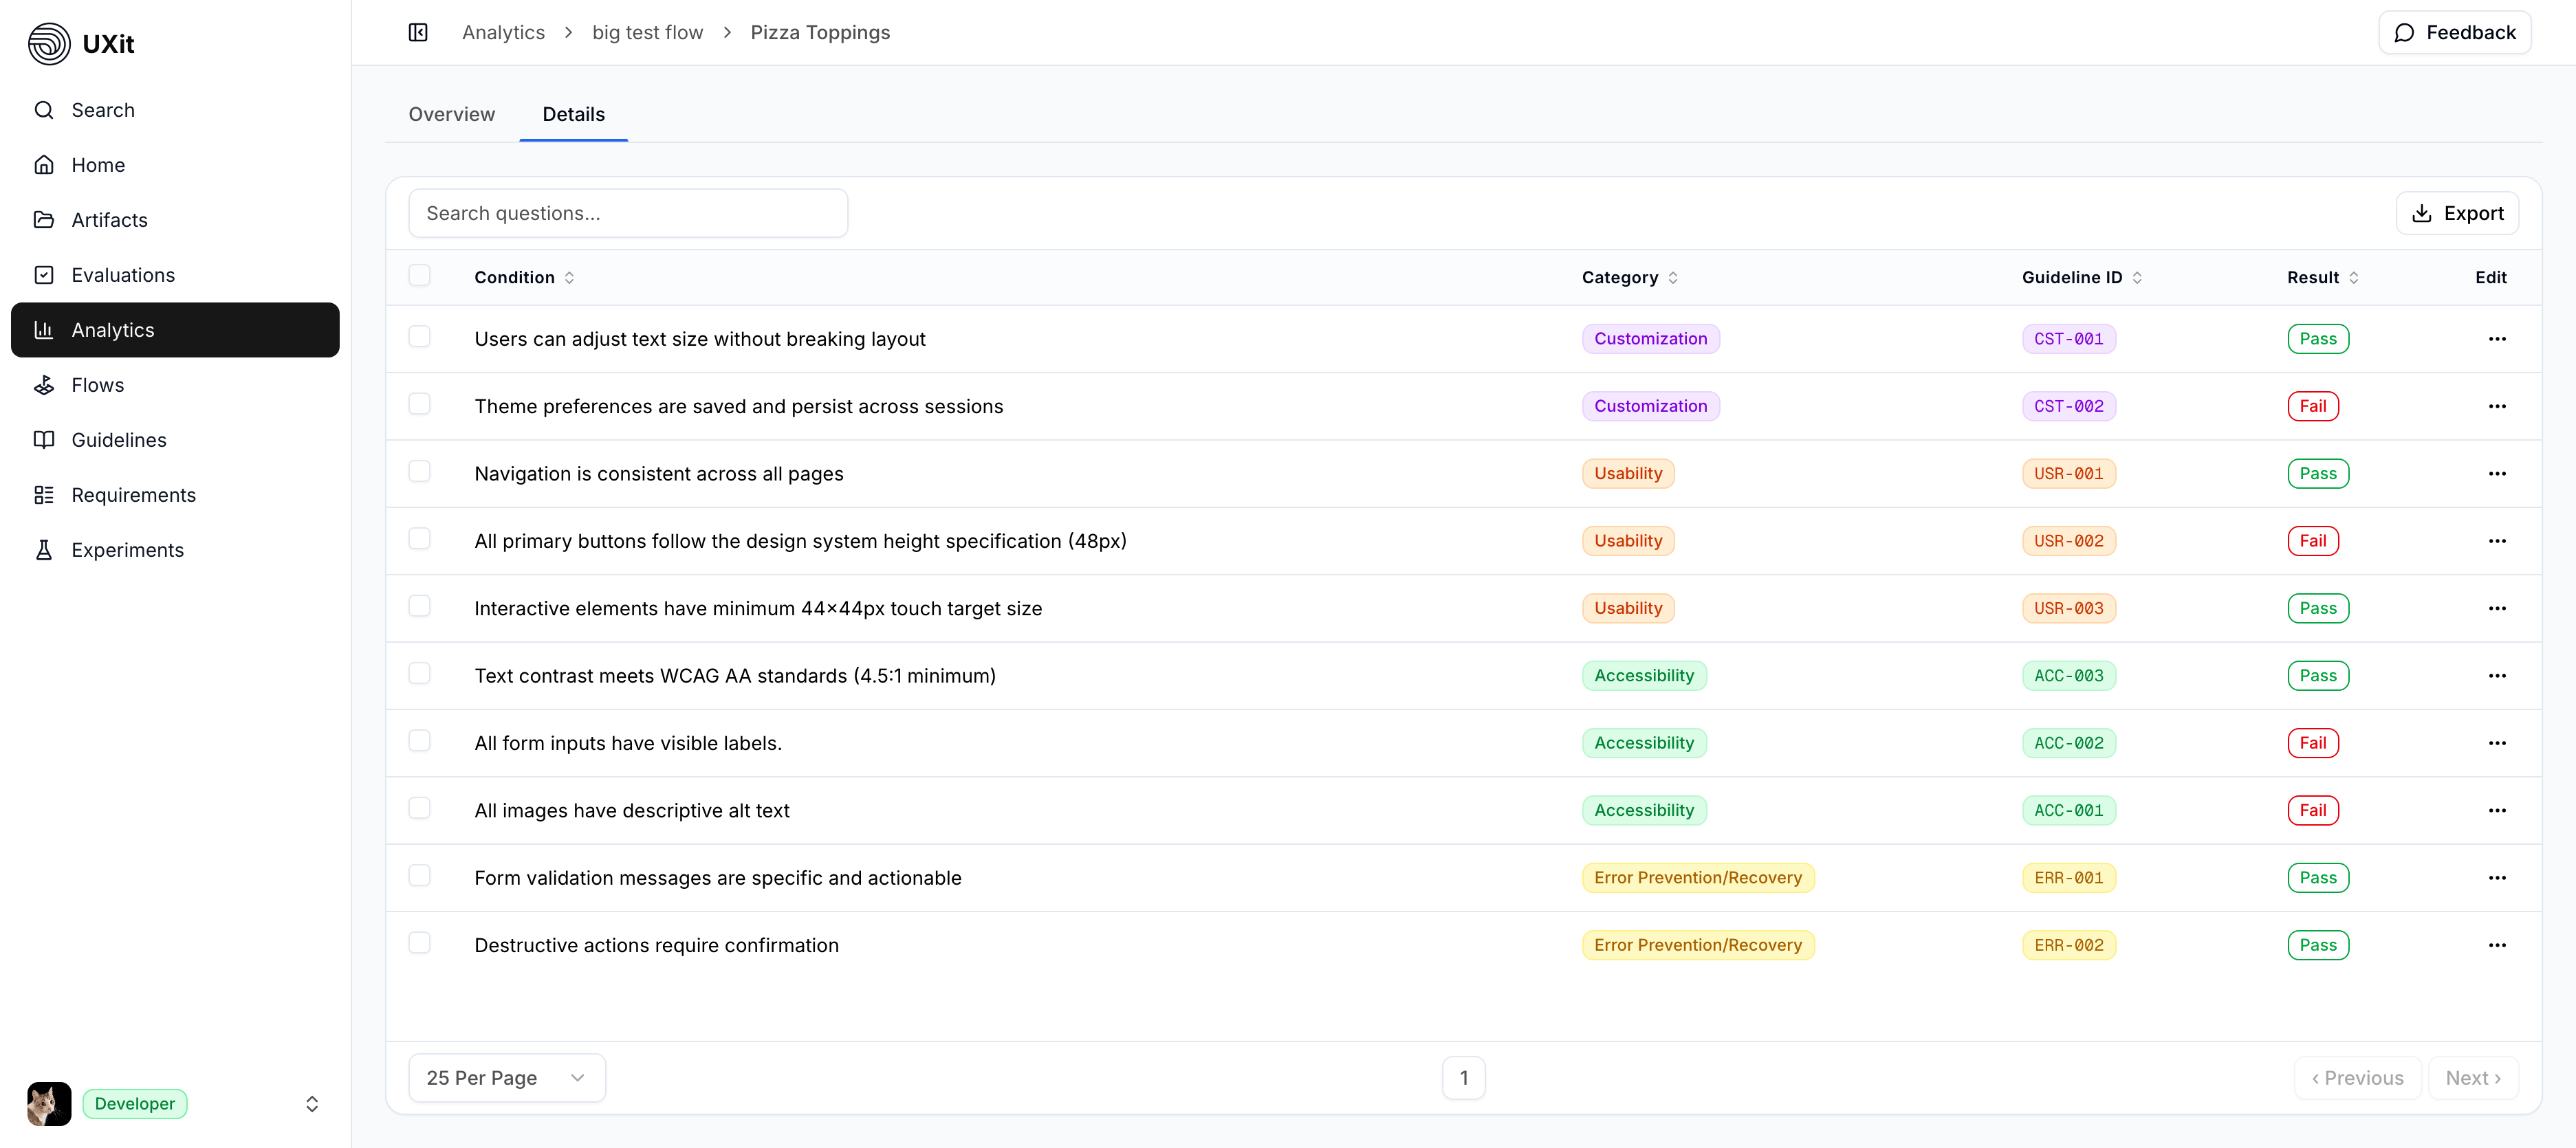
Each row includes:
- Condition: The guideline criterion being evaluated.
- Category: The guideline category the condition belongs to.
- Guideline ID: The short reference ID for that condition.
- Result: The recorded outcome, such as Pass or Fail.
- Edit: The action used to open that condition in a side panel.
This view is useful when you want to:
- Review the full result set one condition at a time.
- Search for a specific condition more quickly.
- Scan pass and fail results in a direct table format.
- Work through the evaluation in a way that is more structured than charts.
Open A Condition
Use the ellipsis menu in the Edit column to open a condition in the right-side panel.
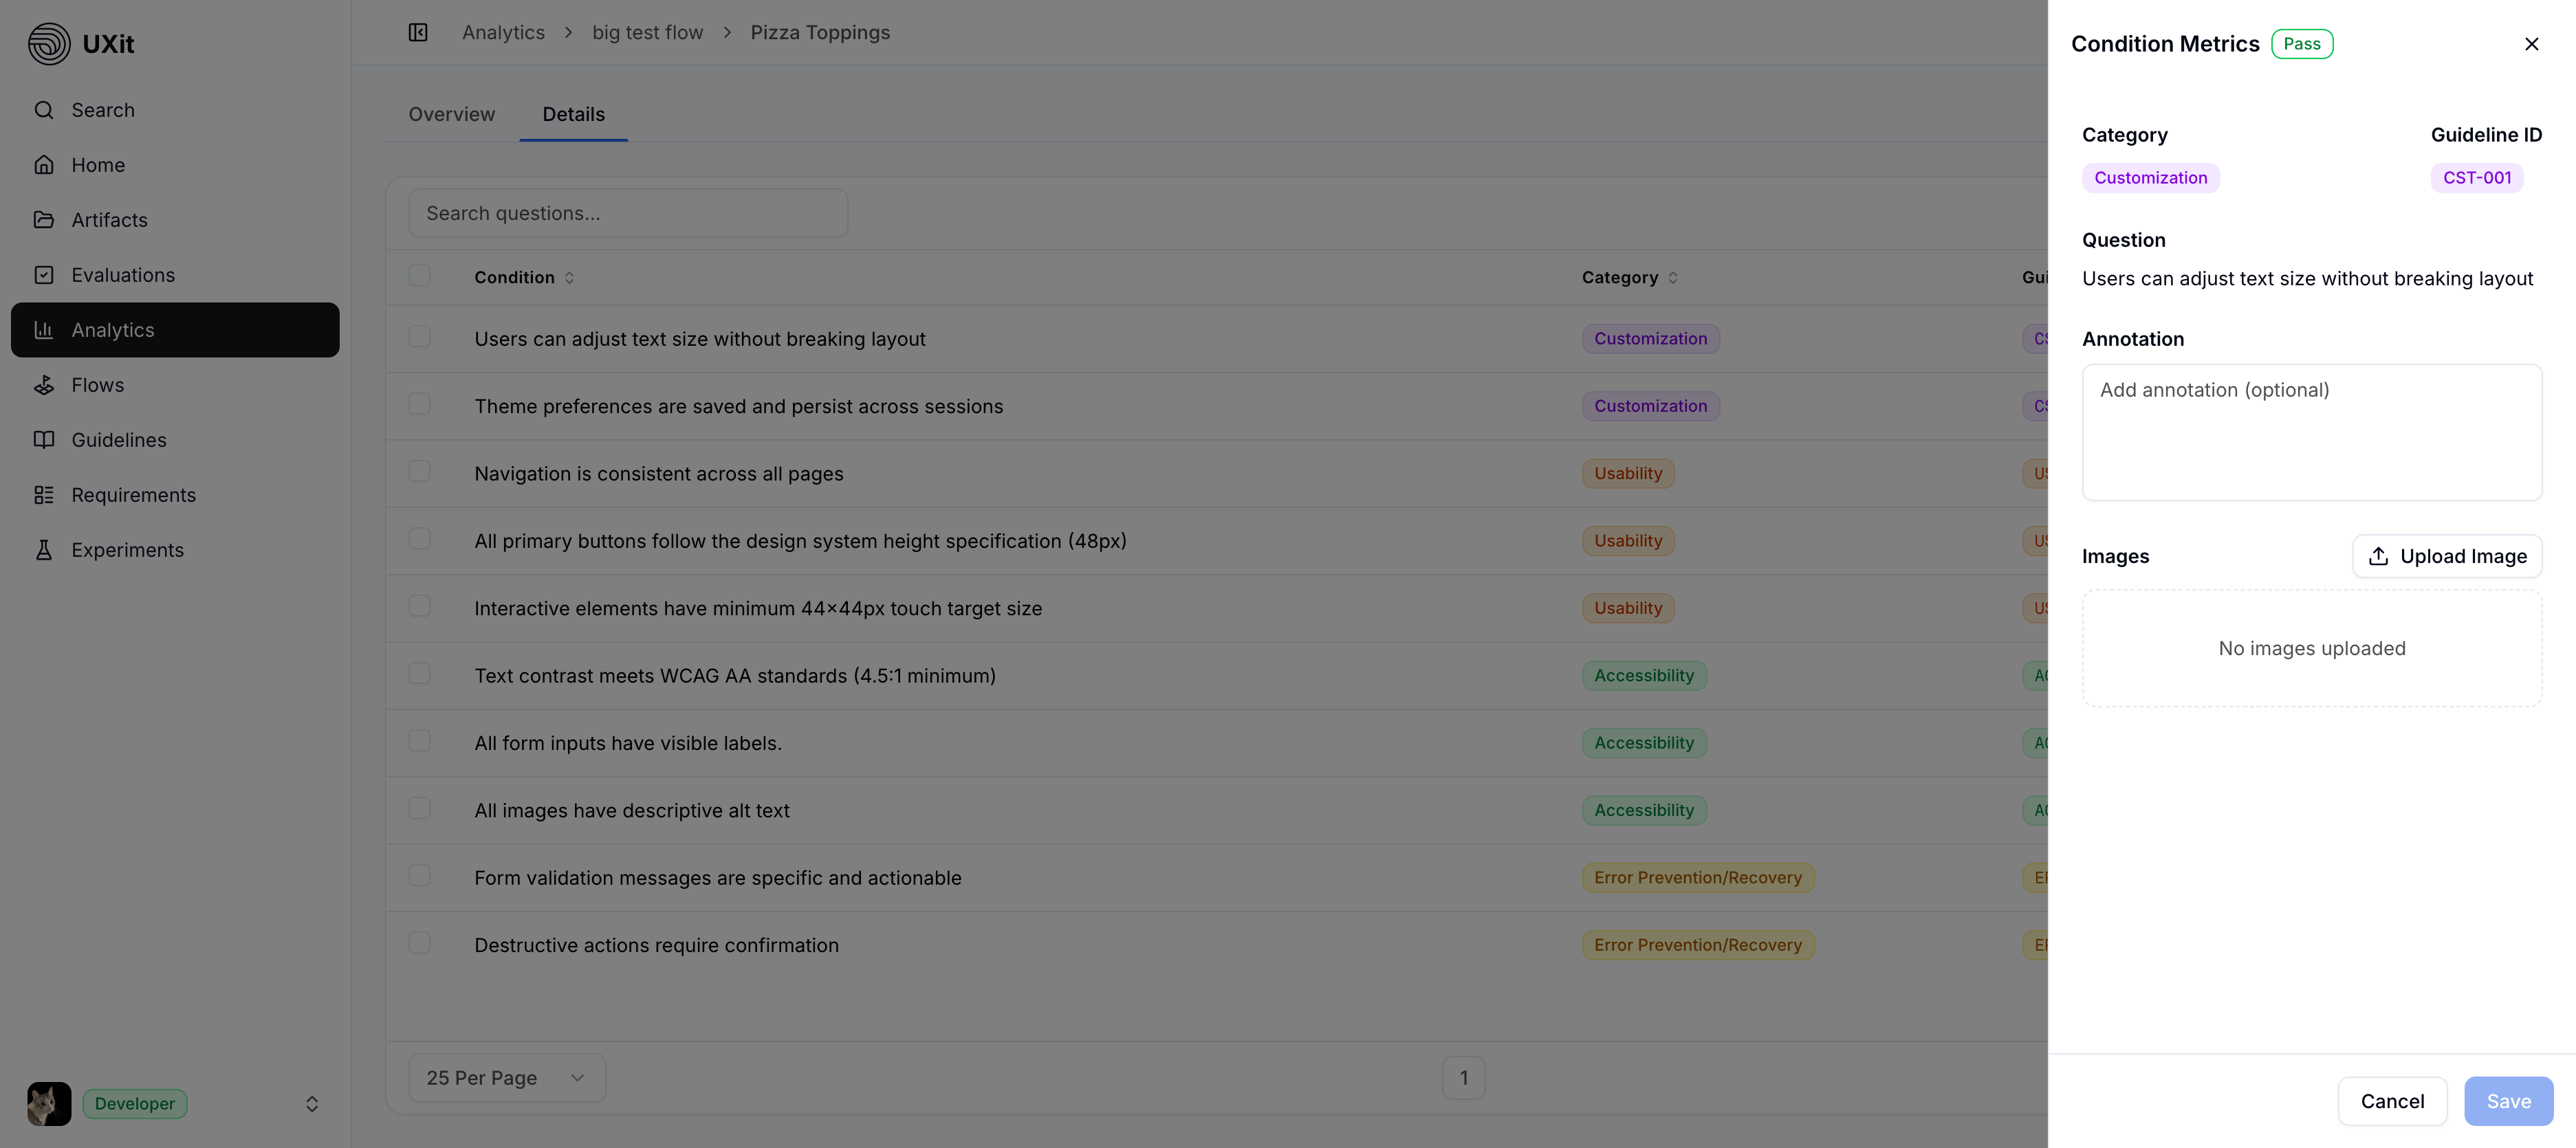
The panel repeats the key information from the table so you can review the selected result without losing context. At the top, you can see the result, category, guideline ID, and question text for the condition you opened.
Annotations
The side panel includes an annotation field for notes.
These notes may already exist if they were added during the evaluation process, and they can also be reviewed, updated, or expanded later from Condition Details.
Annotations are helpful when a failed condition needs location-specific context. For example, a condition may fail because of one button, one label, or one section inside a larger screen. Instead of relying only on the condition text, the note can explain exactly where the issue appears.
Reference Images
Below the annotation field, you can attach supporting images for the selected condition.
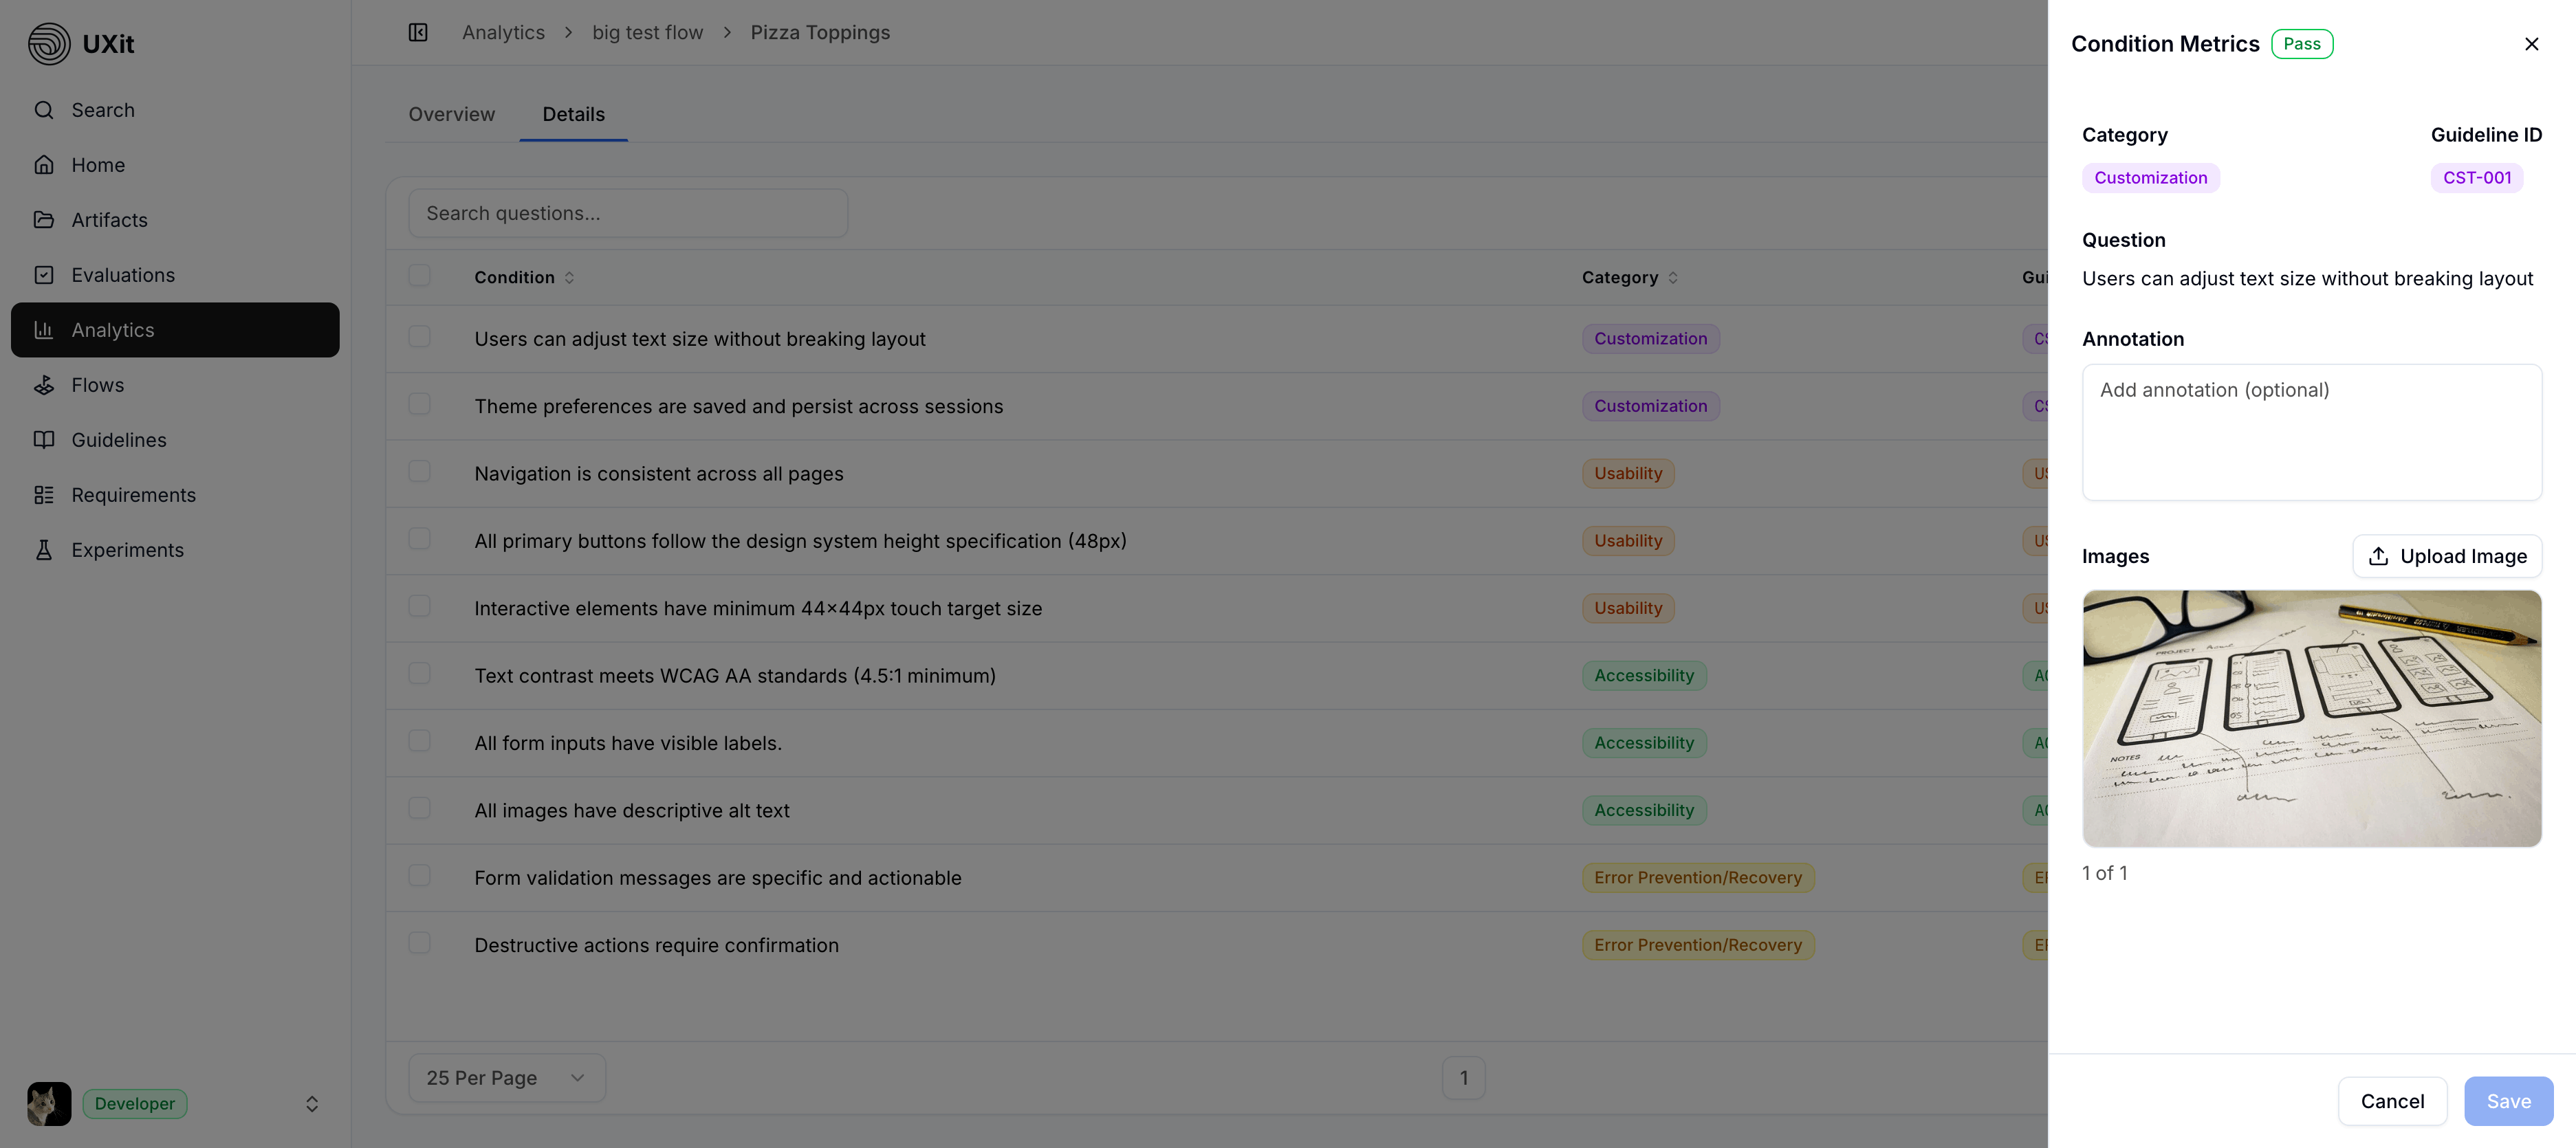
Images are useful when text alone would be slow or unclear. Instead of describing a specific button, paragraph, or control in detail, you can attach a screenshot, mockup, or other reference image that shows the issue directly.
If more than one image is attached to a condition, the panel displays them in a carousel so you can move through multiple references for the same item.
Hosted Image Optimization
When images are uploaded to UXit-hosted storage, they may be optimized and converted to reduce hosted file usage.
If you later download a hosted image, it may not match the original upload exactly. Use a supported external CDN connection if you need externally managed file storage outside the hosted optimization path.
Best Practices
- Start in
Metricswhen you want a summary of performance and trends. - Use
Condition Detailswhen you need the full condition-by-condition result set. - Add annotations when a failure needs more context than the table can show on its own.
- Attach images when a visual reference will explain an issue faster than text alone.
- Use category names and guideline IDs to connect findings back to the original guideline set.